Testing#
Overview#
We maintain two kinds of tests: unit tests and integration tests.
Overall, you want to write the tests that maximize coverage while minimizing maintenance. In practice, this usually means investing heavily in unit tests, which tend to be the most robust to changes in the code base.
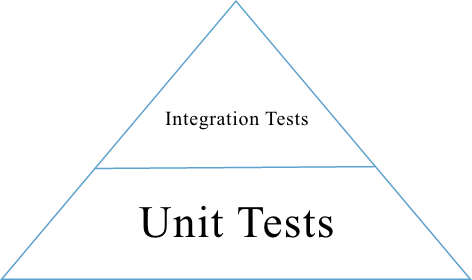
Test Pyramid#
The pyramid above shows the relative number of unit tests and integration tests. Most of our tests are unit tests or integration tests.
Test Types#
Unit Tests#
Each test case should be concise: setup, execute, check, and teardown. If you find yourself writing tests with many steps, consider refactoring the unit under tests into smaller units, and then testing those individually.
As a rule of thumb, your unit tests should cover every code branch.
Mock or patch external dependencies using unittest.mock functions.
We unit test Python code (using unittest) and Javascript (using Jasmine)
Integration Tests#
Test several units at the same time. Note that you can still mock or patch dependencies that are not under test! For example, you might test that
LoncapaProblem,NumericalResponse, andCorrectMapin thecapapackage work together, while still mocking out template rendering.Use integration tests to ensure that units are hooked up correctly. You do not need to test every possible input–that’s what unit tests are for. Instead, focus on testing the “happy path” to verify that the components work together correctly.
Many of our tests use the Django test client to simulate HTTP requests to the server.
Test Locations#
Python unit and integration tests: Located in subpackages called
tests. For example, the tests for thecapapackage are located inxmodule/capa/tests.Javascript unit tests: Located in
specfolders. For example,xmodule/js/specand{cms,lms}/static/js/specFor consistency, you should use the same directory structure for implementation and test. For example, the test forsrc/views/module.jsshould be written inspec/views/module_spec.js.
Factories#
Many tests delegate set-up to a “factory” class. For example, there are factories for creating courses, problems, and users. This encapsulates set-up logic from tests.
Factories are often implemented using FactoryBoy.
In general, factories should be located close to the code they use. For
example, the factory for creating problem XML definitions is located in
xmodule/capa/tests/response_xml_factory.py because the
capa package handles problem XML.
Running Python Unit tests#
The following commands need to be run within a Python environment in which requirements/edx/testing.txt has been installed. If you are using a Docker-based Open edX distribution, then you probably will want to run these commands within the LMS and/or CMS Docker containers.
We use pytest to run Python tests. Pytest is a testing framework for python and should be your goto for local Python unit testing.
Pytest (and all of the plugins we use with it) has a lot of options. Use pytest –help to see all your option and pytest has good docs around testing.
Running Python Test Subsets#
When developing tests, it is often helpful to be able to really just run one single test without the overhead of PIP installs, UX builds, etc.
Various ways to run tests using pytest:
pytest path/test_module.py                          # Run all tests in a module.
pytest path/test_module.py::test_func               # Run a specific test within a module.
pytest path/test_module.py::TestClass               # Run all tests in a class
pytest path/test_module.py::TestClass::test_method  # Run a specific method of a class.
pytest path/testing/                                # Run all tests in a directory.
For example, this command runs a single python unit test file:
pytest xmodule/tests/test_stringify.py
Note - edx-platorm has multiple services (lms, cms) in it. The environment for each service is different enough that we run some tests in both environments in Github Actions. To test in each of these environments (especially for tests in “common” and “xmodule” directories), you will need to test in each seperately. To specify that the tests are run with the relevant service as root, Add –rootdir flag at end of your pytest call and specify the env to test in:
pytest test --rootdir <lms or cms>
Or, if you need django settings from a particular enviroment, add –ds flag to the end of your pytest call and specify the django settings object:
pytest test --ds=<lms.envs.test or cms.envs.test>
Various tools like ddt create tests with very complex names, rather than figuring out the name yourself, you can:
Select tests to run based on their name, provide an expression to the pytest -k option which performs a substring match on test names:
pytest xmodule/tests/test_stringify.py -k test_stringify
Alternatively, you can the get the name of all test methods in a class, file, or project, including all ddt.data variations, by running pytest with –collectonly:
pytest xmodule/tests/test_stringify.py --collectonly
Testing with migrations#
For the sake of speed, by default the python unit test database tables
are created directly from apps’ models. If you want to run the tests
against a database created by applying the migrations instead, use the
--create-db --migrations option:
pytest test --create-db --migrations
Debugging a test#
There are various ways to debug tests in Python and more specifically with pytest:
using the verbose -v or really verbose -vv flags can be helpful for displaying diffs on assertion failures
if you want to focus on one test failure at a time, the
--exitfirst``or ``-xflags to have pytest stop after the first failureby default, the plugin pytest-randomly will randomize test case sequence. This is to help reveal bugs in your test setup and teardown. If you do not want this randomness, use the –randomly-dont-reorganize flag
if you pass the
--pdbflag to a pytest call, the test runner will drop you into pdb on error. This lets you go up and down the stack and see what the values of the variables are. Check out the pdb documentation. Note that this only works if you aren’t collecting coverage statistics (pdb and coverage.py use the same mechanism to trace code execution).If there is a specific point in code you would like to debug, you can add the build-in “breakpoint()” function there and it will automatically drop you at the point next time the code runs. If you check this in, your tests will hang on jenkins. Example of use:
if True:
  # you will be dropped here in the pdb shell when running test or code
  breakpoint()
  a=2
  random_variable = False
How to output coverage locally#
These are examples of how to run a single test and get coverage:
pytest cms/djangoapps/contentstore/tests/test_import.py --cov --cov-config=.coveragerc-local # cms example
pytest lms/djangoapps/courseware/tests/test_block_render.py --cov --cov-config=.coveragerc-local # lms example
That --cov-conifg=.coveragerc-local option is important - without it, the coverage
tool will look for paths that exist on our jenkins test servers, but not on your local devstack.
How to spit out coverage for a single file with a list of each line that is missing coverage:
pytest lms/djangoapps/grades/tests/test_subsection_grade.py \
    --cov=lms.djangoapps.grades.subsection_grade \
    --cov-config=.coveragerc-local \
    --cov-report=term-missing
---------- coverage: platform linux2, python 2.7.12-final-0 ----------

Name                                        Stmts   Miss  Cover   Missing
-------------------------------------------------------------------------
lms/djangoapps/grades/subsection_grade.py     125     38    70%   47-51, 57, 80-81, 85, 89, 99, 109, 113, [...]
Use this command to generate a coverage report (after previously running pytest):
coverage report
The above command looks for a test coverage data file in reports/.coverage - this file will
contain coverage data from your last run of pytest. Coverage data is recorded for whichever
paths you specified in your --cov option, e.g.:
--cov=.  # will track coverage for the entire project
--cov=path.to.your.module  # will track coverage only for "module"
Use this command to generate an HTML report:
coverage html
The report is then saved in reports/xmodule/cover/index.html
Handling flaky unit tests#
See this confluence document.
Running JavaScript Unit Tests#
Before running Javascript unit tests, you will need to be running Firefox or Chrome in a place visible to edx-platform.
If you are using Tutor Dev to run edx-platform, then you can do so by installing and enabling the
test-legacy-js plugin from openedx-tutor-plugins, and then rebuilding
the openedx-dev image:
tutor plugins install https://github.com/openedx/openedx-tutor-plugins/tree/main/plugins/tutor-contrib-test-legacy-js
tutor plugins enable test-legacy-js
tutor images build openedx-dev
We use Jasmine (via Karma) to run most JavaScript unit tests. We use Jest to
run a small handful of additional JS unit tests. You can use the npm run
test* commands to run them:
npm run test-karma  # Run all Jasmine+Karma tests.
npm run test-jest   # Run all Jest tests.
npm run test        # Run both of the above.
The Karma tests are further broken down into three types depending on how the JavaScript it is testing is built:
npm run test-karma-vanilla  # Our very oldest JS, which doesn't even use RequireJS
npm run test-karma-require  # Old JS that uses RequireJS
npm run test-karma-webpack  # Slightly "newer" JS which is built with Webpack
Unfortunately, at the time of writing, the build for the test-karma-webpack
tests is broken. The tests are excluded from npm run test-karma as to not
fail CI. We may fix this one day.
To run all Karma+Jasmine tests for a particular top-level edx-platform folder, you can run:
npm run test-cms
npm run test-lms
npm run test-xmodule
npm run test-common
Finally, if you want to pass any options to the underlying node invocation
for Karma+Jasmine tests, you can run one of these specific commands, and put
your arguments after the -- separator:
npm run test-cms-vanilla -- --your --args --here
npm run test-cms-require -- --your --args --here
npm run test-cms-webpack -- --your --args --here
npm run test-lms-webpack -- --your --args --here
npm run test-xmodule-vanilla -- --your --args --here
npm run test-xmodule-webpack -- --your --args --here
npm run test-common-vanilla -- --your --args --here
npm run test-common-require -- --your --args --here
Code Quality#
We use several tools to analyze code quality. The full set of them is:
mypy $PATHS...
pycodestyle $PATHS...
pylint $PATHS...
lint-imports
scripts/verify-dunder-init.sh
make xsslint
make pii_check
make check_keywords
Where $PATHS... is a list of folders and files to analyze, or nothing if
you would like to analyze the entire codebase (which can take a while).