At-Risk Learner Dashboard Reports#
In the At-Risk Learner Dashboard Reports, you can review the learners’ performance to gain a clear perspective of their engagement and performance in the course and identify those at risk of abandoning or dropping the course. Learners who appear in this dashboard have enrolled in the course, have done something in the course other than visit the course homepage, have not yet passed the course, and have not visited the course in seven or more days.
The charts of this dashboard apply cross-filters to charts whose data sets contain the same name.
At the top of this dashboard, you will find five tabs: Overview, Enrollment, Engagement, Performance, and Help. Each tab shows different information you can filter, choosing one particular learner to understand their behavior and take any necessary action to intervene.
In the tabs, you will find:
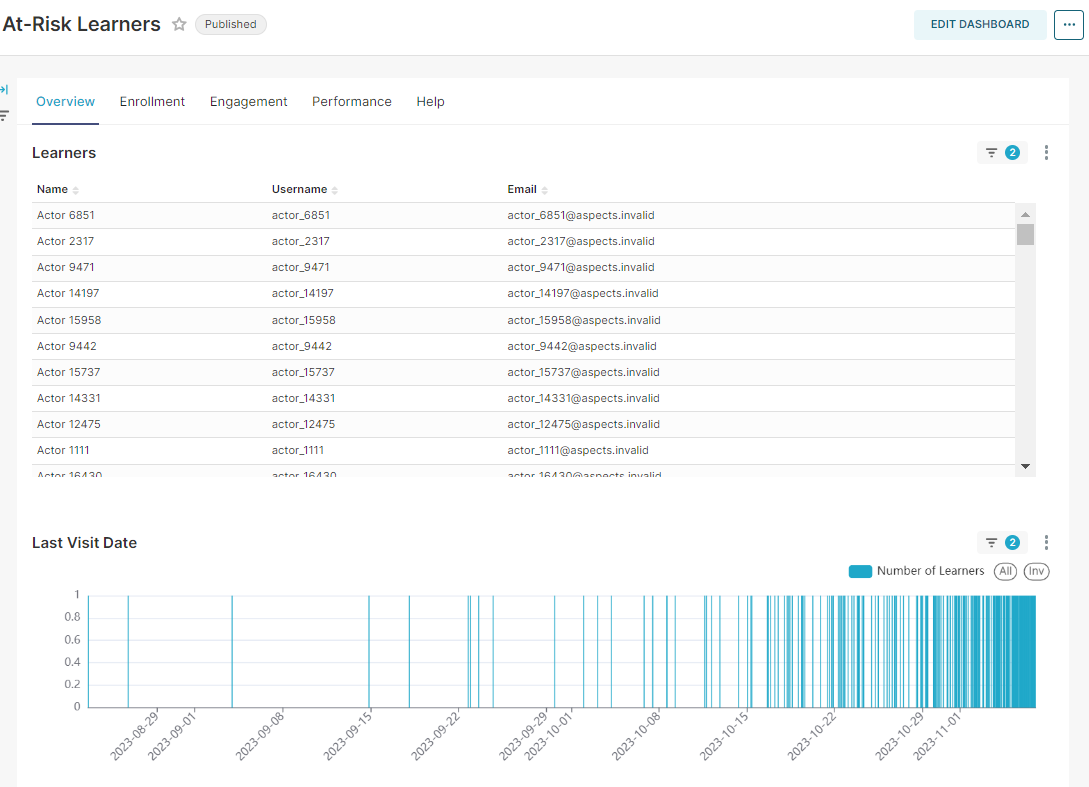
Overview: In this tab, you will find the list of learners with names, usernames, and emails above the last visit date to have a first metric to indicate a risk factor. If you select one user in this tab, that selection will filter the information of the rest of the tabs to show only the information linked to that user. If the name, username, and email address columns are empty, it is because your site operator has chosen to omit limited personally identifiable information from being displayed on your Open edX instance.
Enrollment: This tab has data on enrollment type and date.
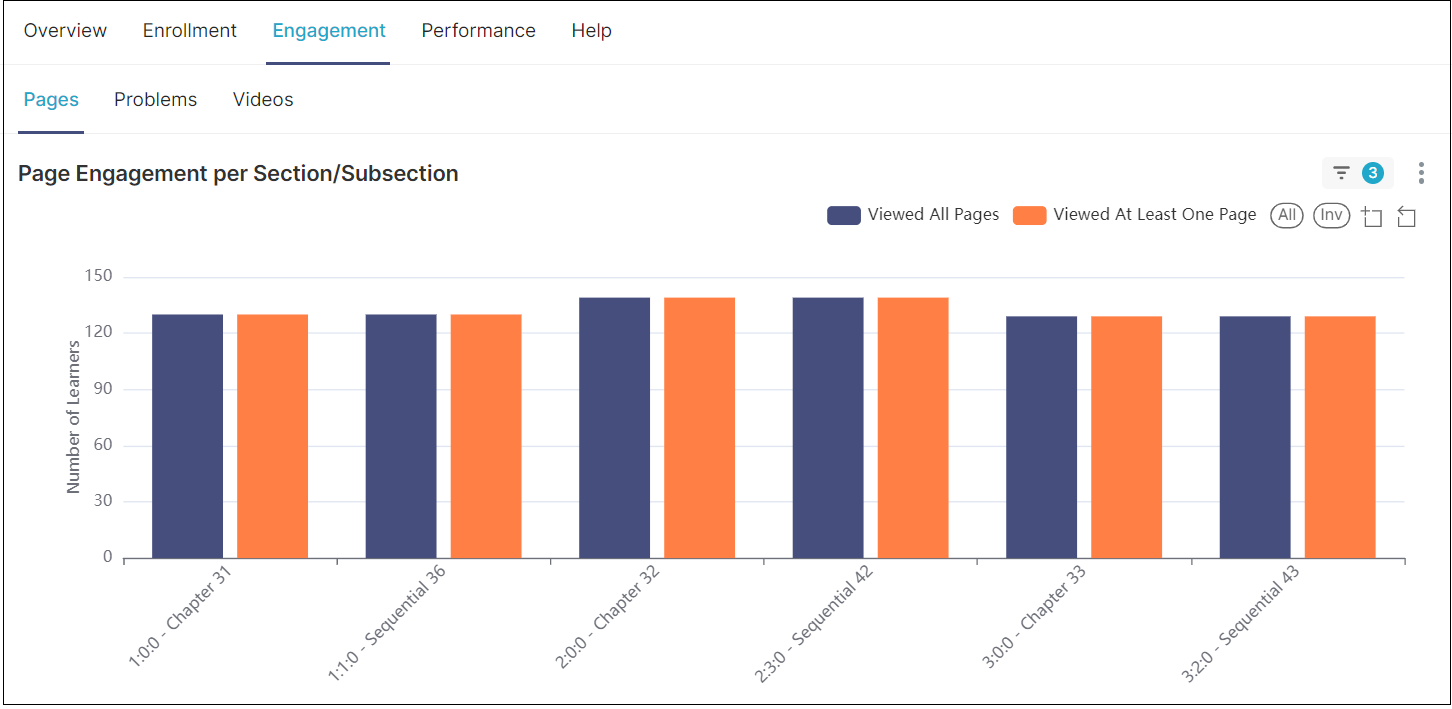
Engagement: This tab contains a detailed report about the learners’ interaction with the course content, particularly with the pages, problems, and videos. This tab will give you relevant information about the troubles the at-risk learner group has with the content in case you need to create an alternative route for them.
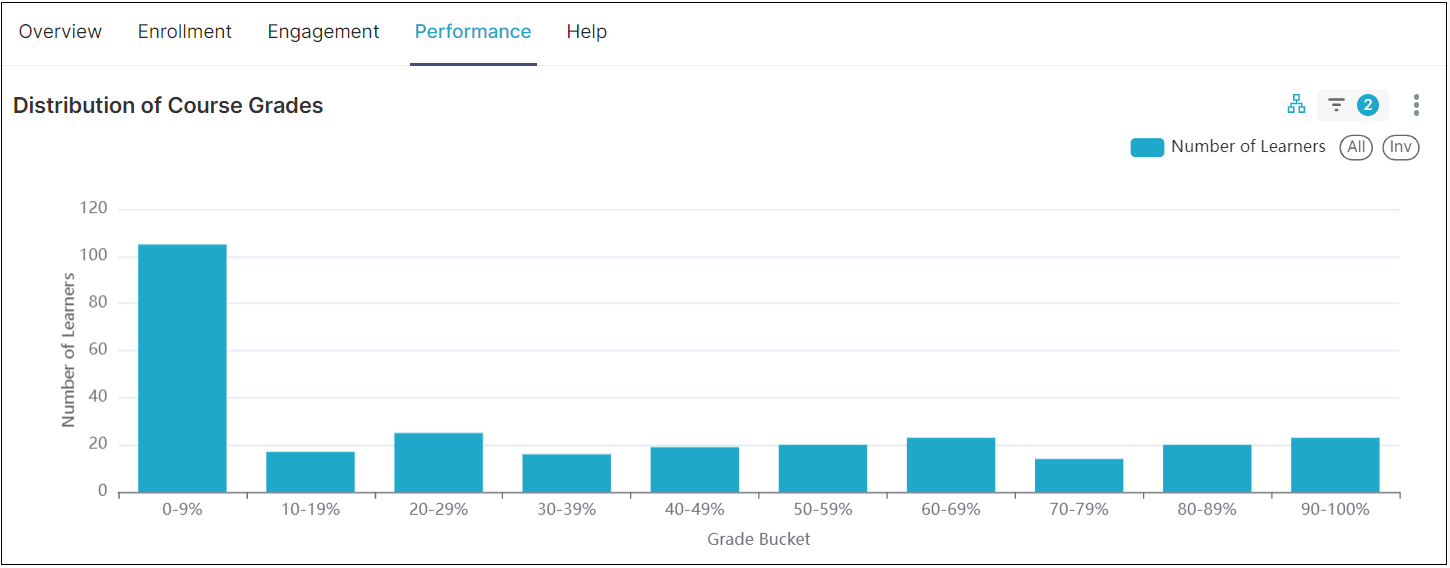
Performance: This tab shows the course grades as a metric of the learner’s performance to indicate the approval percentage.
Help: It takes you to the tool documentation.